![]()
![]()
![]()
![]()
![]()
![]()
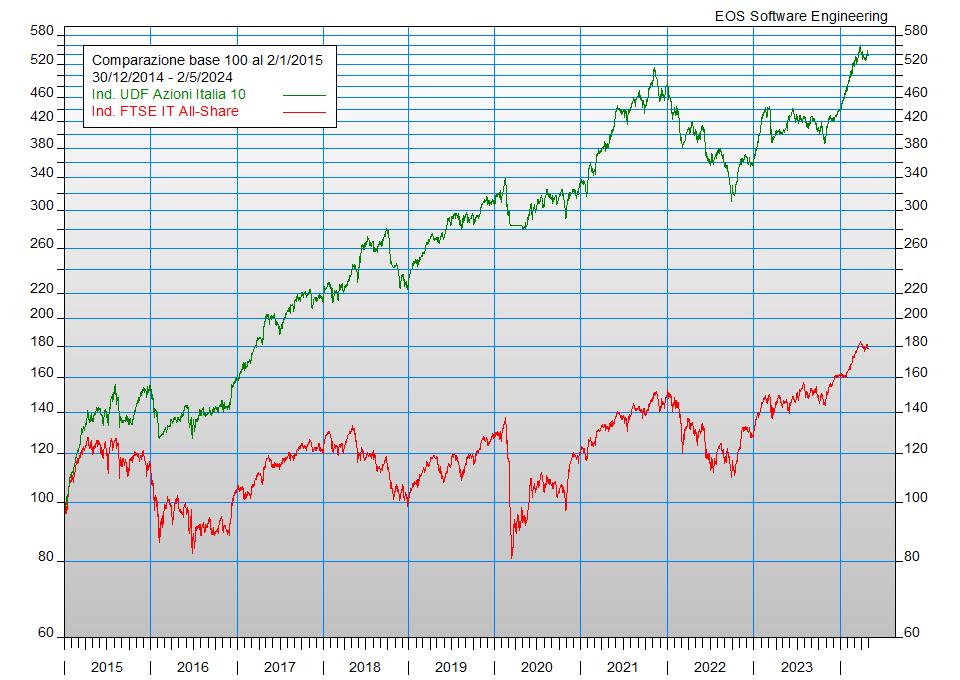
The versatility of the Up-Down Forecast expert system allows to carry out analyses on different markets and different types of financial instruments: the results obtained in the medium-long term tests have always proved to be superior to those of the reference indices, albeit with the same risk . The use out of test, starting from 2015, confirmed the potential of the system.
By way of example, the results obtained by different Up-Down Forecast models in the period following the test phase completed in 2014 are shown below in both graphical and tabular form. The different models operate on a basket consisting of approximately 90 stocks traded on the Italian market, and differ from each other in the maximum number of stocks that the system can hold at any time.
The returns shown are gross of fees, expenses and tax effects; they reflect the historical trend of the expert system and therefore do not constitute an indication of future returns. The operations are carried out virtually at the closing price of the day on which the expert system generated the buy or sell signal; therefore, the actual results can also differ significantly from the theoretical ones. The data reported also refer to the results obtained by applying the most recent models implemented by EOS and may therefore differ from the trend recorded by the asset management in which the indications provided by previous models have been used.
 UDF Italia 5 (*) |
 UDF Italia 8 |
 UDF Italia 10 |
 UDF Italia 12 |
 UDF Italia 15 |
NOTE: All charts are updated to the previous day and have been created by Up-Down Chart application.
Performances from 2012 to 2024
| Year | FTSE IT All-Share |
UDF Italia 5 (*) | UDF Italia 8 | UDF Italia 10 | UDF Italia 12 | UDF Italia 15 | |||||
| 2015 | +15,38% | +40,75% | (+25,37%) | +25,93% | (+10,55%) | +55,08% | (+39,70%) | +42,50% | (+27,12%) | +42,17% | (+26,79%) |
| 2016 | -9,90% | +3,24% | (+13,14%) | +3,66% | (+13,56%) | +2,54% | (+12,44%) | +4,89% | (+14,79%) | -4,90% | (+5,00%) |
| 2017 | +15,55% | +61,29% | (+45,74%) | +46,97% | (+31,42%) | +34,74% | (+19,19%) | +48,44% | (+32,89%) | +53,17% | (+37,62%) |
| 2018 | -16,71% | +22,88% | (+39,59%) | +7,13% | (+23,84%) | +5,49% | (+22,20%) | +4,28% | (+20,99%) | +1,82% | (+18,53%) |
| 2019 | +27,20% | +29,41% | (+2,21%) | +24,88% | (-2,32%) | +36,22% | (+9,02%) | +31,43% | (+4,23%) | +38,49% | (+11,29%) |
| 2020 | -5,56% | +6,17% | (+11,73%) | +5,38% | (+10,94%) | +5,36% | (+13,05%) | -3,90% | (+1,66%) | -2,11% | (+3,45%) |
| 2021 | +23,71% | +9,27% | (-14,44%) | +29,38% | (+5,67%) | +45,60% | (+21,89%) | +38,73% | (+15,02%) | +42,30% | (+18,59%) |
| 2022 | -14,10% | +1,12% | (+15,22%) | -18,50% | (-4,40%) | -26,13% | (-12,03%) | -16,77% | (-2,67%) | -22,01% | (-7,91%) |
| 2023 | +26,28% | +49,42% | (+23,14%) | +28,84% | (+2,56%) | +22,89% | (-3,39%) | +24,13% | (-2,15%) | +13,74% | (-12,54%) |
| 2024 | +12,04% | +25,42% | (+13,38%) | +32,58% | (+20,54%) | +33,71% | (+21,67%) | +28,90% | (+16,86%) | +30,51% | (+18,47%) |
(*) The model relating to the "UDF Italia 5" system was updated on February 18, 2020. The results obtained from the model used previously can be consulted at the following
link.